Visualizer
Access our Always-On mobile data with our easy-to-use, self-service visualization tool
Visualizer is great for

Retailers & Restaurants

Real-estate Developers

GIS Analysts

Cities
Identifying high-value retail districts
Making smarter site selection decisions
Evaluating the health of current retail locations
Enhancing trade area forecasts
Detecting cannibalization issues
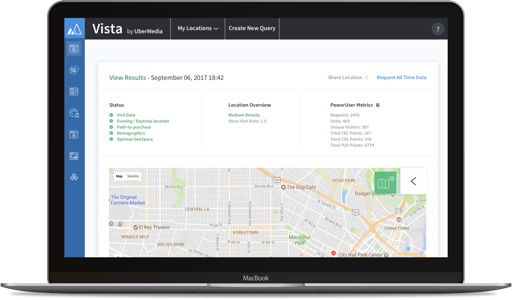
Explore Brand & Location Health Through a Powerful Dashboard
-
Data Visualization in MinutesInteractive, data-rich maps at your fingertips upon sign up. Immediately visualize our most powerful retail data sets to get an accurate understanding of customers — their paths, points of origin, and more!Available for the U.S. and select other markets
-
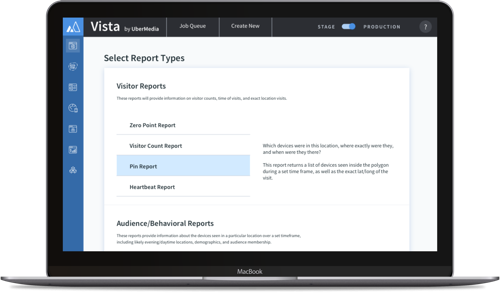
Powerful, Filtering Data SetsView and compare Pathing and Point of Origin data sets with easy-to-use, time-of-day, and day-of-week filters
-
Share Interactive Maps with ClientsShare secure, interactive maps with clients with our easy publishing feature
Advanced Features
- Pull data for hundreds of locations and extended timeframes using shapefiles, GeoJSONs, or our Proprietary Retail Boundaries
- Our data sets integrate easily into your GIS workflow including ESRI’s
- Historical data going back to January 2014
- Access to additional datasets